
How Bad Is It, Really?

Chart of Growth in U.S.Gross Domestic Product (GDP)
Back in the early 1980's, Alan Greenspan, the former Chairman of the Federal Reserve Bank, came up with a great idea. He reasoned that if the price of one commodity goes up, consumers will switch to another commodity in its place. On the basis of this reasoning, the method of calculating the Consumer Price Index was changed. The result is that the inflation rate reported by the US Government is reported to be lower than it would if it was still calculated the old way.

John Williams, the economist who operates "Shadow Government Statistics" likes to publish economic statistics as they would be if the CPI methodology hadn't been changed. This chart is a comparison of growth in the "real" (adjusted for inflation) US Gross Domestic Product using both the current CPI and the old methodology. When the line is above zero the economy is growing, with higher levels being greater levels of growth. When the line is below zero, the economy is shrinking, and in a recession. The lower the line goes, the more severe the recession.

The chart speaks for itself. The recession is deeper and has been around longer than the government tells us.

Chart of U.S. Unemployment
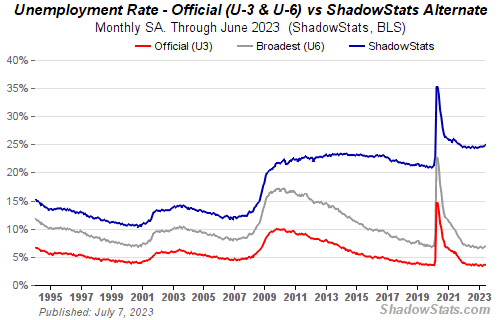
The GDP isn't the only place John believes the government is cooking the books. This second chart is of the unemployment rate, with the "discouraged" workers added back into the numbers. According to Williams, these workers were "defined out of existence in 1994."

Lets see, 22% unemployment and GDP contracting at a 6% annualized rate and has been for the last decade except for a tiny spurt of growth in 2004.

Yep, Keynesian economics is workin' jus' fine. 'Specially with those nice men from the government here to help us.

Comments

Popular posts from this blog

Agregate Demand and the US Savings Rate

In my last post, I touched on the differences between the economic theories of John Maynard Keynes and Ludwig von Mises. Immediately aftward, I was directed to this story in the New York Times. It seems that americans are saving more instead of spending the their money on consumer goods. Up until this downturn, about 70% of the US Economy was consumer spending, and in 2005, the US Savings rate was negative 2.7%. The "stimulus" is supposed to stimulate spending to get money moving again. But it isn't happening as planned. Folks are saving for down payments because they don't expect to get zero down home mortgages; they're saving to replenish their decimated retirement and college funds. The austrians believe that the best way to "fix" the economy is to allow the "malinvestment" created by the false signals in the economy (from the open market ops and deficit spending) to be liquidated and the resources repurposed into better investments. It...

Haiti Adoption Story

Most of us have seen or read stories of adoptions of Haitian children following the earthquake last month. Some of the stories have had a positive slant (the charity has saved children...) other's have had a negative slant (the "missionaries" who kidnapped and tried to smuggle 33 children across the border into the Dominican Republic). At a family gathering yesterday, my wife heard a story about a couple that was "finally" able to adopt a child they've been trying to adopt for about 4 years. As the story was related to me, this couple had originally been matched with this child about 4 years ago, but the adoption was cancelled when the parents of the child took her back and parented her themselves. After about three years of caring for the child, the natural parents returned her to the orphanage because both of them had been diagnosed with tuberculosis; a death sentence in Haiti. (Mortality for untreated TB is about 67%.) The adoption was finalized just befo...

Conventional Wisdom Meets Reality:
There Ought Not to be a Law

The "before" picture of an intersection near Bristol, England: Maximum traffic of 1700 cars per hour and about 300 pedestrians. Commute time for some people using the intersection over 20 minutes in rush hour traffic. The "after" picture: Traffic flow increased to 2000 cars per hour, and still handles the 300 pedestrians. Commute time reduced to just 5 minutes. In the eight months since the change, there have only been two minor incidents, and not a single person (motorist or pedestrian) has been injured in an accident. How did they do it? What new technology did they use to effect this miraculous change? They took out the traffic conrol signals! Yes, you read that right, the traffic lights were removed. By removing all of the red, yellow and green lights, the motorists became more courteous, more cautious, and more sharing of the road way. In complete defiance of the conventional wisdom. This experiment raises a lot of very interesting questions. First, do our pre...